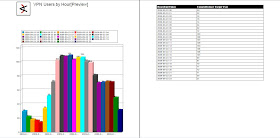
Anyway, I've got a story about how cool queries are. And about how much of an Excel badass I am. And also about how queries are still better. Last month, I got a request from one of our architects who was running down an issue related to client VPN activity. Specifically, he wanted to know how many remote VPN users we had over time for a particular morning. Since we feed those logs to ESM, I was a logical person to ask for the information.
So I pulled up the relevant events in an active channel and realized that I wasn't going to be able to work this one out just sorting columns. So, without thinking, I exported the events and pulled them up in Excel. So here's the Excel badass part:


If you want to copy it, here it is:
=SUM(IF(FREQUENCY(MATCH(A2:A3653,A2:A3653,0),MATCH(A2:A3653,A2:A3653,0))>0,1))
So A is the column that usernames are in. This formula uses the MATCH function to create a list of usernames and then the FREQUENCY function to count the unique values in the match lists. You need two MATCH lists to make FREQUENCY happy because it requires two arguments, hence the redundancy. It took about an hour for me to put it together, most of that was spent finding the row numbers that corresponded to the time segment borders.
But as I finished it up and sent it off to the requesting architect, I thought, there must be an easier way. And of course there is. So here's how you do the same thing in ESM using queries:


So, it's just EndTime with the hour function applied, and TargetUserName with the count function applied, and the Unique box (DISTINCT for the Oracle DBA's playing at home) checked. And then on the Conditions tab you create your filter to select only the events you want to query against. That's it.
Once the query is created, just run the Report Wizard and go. All told, it's about 90 seconds to the same thing with a query and report that it took an hour to do in Excel.

No comments:
Post a Comment